![http://UPSC%20coaching%20in%20India%20-%20Best%20UPSC%20coaching%20institute%20-%20UPSC%20Mentor%20coaching%20-%20UPSC%20preparation%20institute%20-%20IAS%20coaching%20center%20-%20UPSC%20online%20coaching%20-%20Best%20IAS%20coaching%20in%20India%20-%20UPSC%20classes%20for%20beginners%20-%20Civil%20services%20preparation%20-%20IAS%20preparation%20institute%20-%20UPSC%20mentorship%20program%20-%20UPSC%20exam%20guidance%20-%20IAS%20study%20material%20-%20UPSC%20Prelims%20coaching%20-%20UPSC%20Mains%20coaching%20-%20UPSC%20interview%20preparation%20-%20Best%20IAS%20online%20classes%20-%20UPSC%20coaching%20with%20personal%20mentorship%20-%20Affordable%20UPSC%20coaching%20-%20UPSC%20test%20series%20-%20UPSC%20coaching%20near%20me%20-%20Best%20IAS%20coaching%20near%20me%20-%20UPSC%20institute%20in%20[your%20city]%20-%20IAS%20coaching%20center%20in%20[your%20city]%20-%20The%20UPSC%20Mentor%20coaching%20-%20The%20UPSC%20Mentor%20IAS%20classes%20-%20The%20UPSC%20Mentor%20UPSC%20course%20-%20UPSC%20Mentor%20online%20program.](https://theupscmentor.in/wp-content/uploads/2024/11/THE-UPSC-2-e1762319162137.png)
 admin
admin 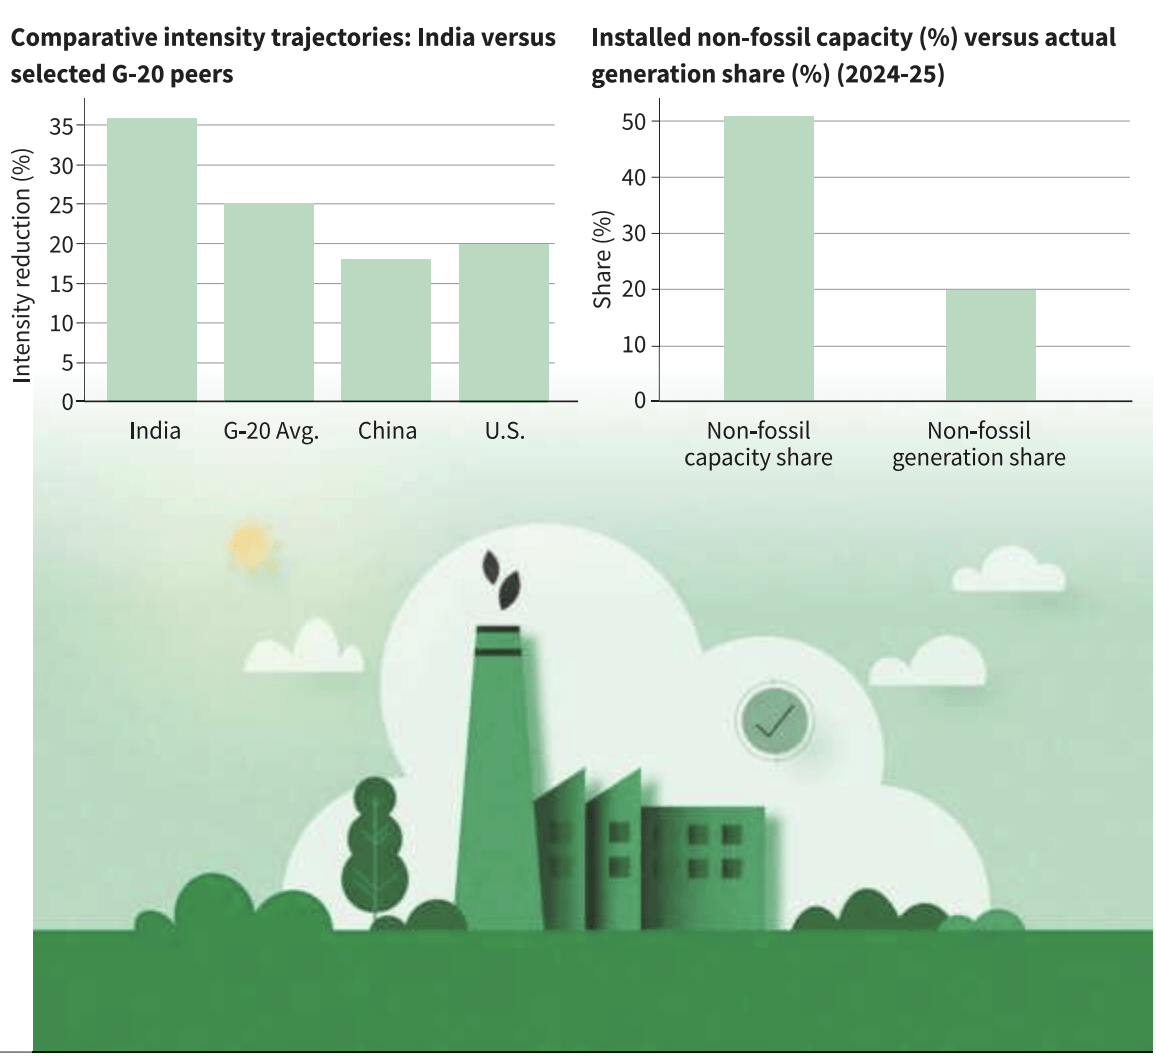
0.1 What India committed to under global climate agreements
0.1.1 India committed to climate targets based on the principle of common but differentiated responsibilities, recognising lower historical emissions compared to developed countries.
0.1.2 The key commitments included reducing emissions intensity of GDP by 33–35% from 2005 levels by 2030, expanding non-fossil power capacity, increasing renewable energy, and creating carbon sinks through forests.
0.2 Reduction in emissions intensity: what it means
0.2.1 Emissions intensity refers to greenhouse gas emissions per unit of economic output, not total emissions.
0.2.2 Using 2005 as the baseline, India reduced emissions intensity by about 36% by 2020, achieving the original target well before 2030.
0.3 Why intensity reduction looks successful on paper
0.3.1 Rapid expansion of non-fossil power sources such as solar, wind, hydro, and nuclear reduced the carbon intensity of electricity generation.
0.3.2 By 2023, non-fossil capacity exceeded 43% and reached around 50% by mid-2025.
0.3.3 Structural changes in the economy towards services and digital sectors also lowered emissions per unit of GDP.
0.3.4 Energy efficiency programmes such as PAT and UJALA reduced electricity demand growth and avoided emissions.
0.4 The core problem: intensity reduction vs absolute emissions
0.4.1 Despite falling emissions intensity, absolute greenhouse gas emissions remain high.
0.4.2 India’s total territorial GHG emissions were approximately 2,959 MtCO₂e in 2020, and absolute emissions continued to remain elevated afterward.
0.4.3 This happens because GDP growth has been faster than emissions reduction, leading to partial decoupling rather than absolute decline.
0.5 Why absolute emissions matter
0.5.1 Climate impact depends on total emissions, not emissions per unit of GDP.
0.5.2 National averages hide sectoral differences, as emissions from cement, steel, and transport continued to rise even when power-sector emissions growth moderated.
0.6 Renewable capacity vs actual electricity generation
0.6.1 Installed non-fossil capacity rose from 29.5% in 2015 to 51.4% by June 2025, indicating rapid infrastructure expansion.
0.6.2 However, non-fossil sources generated only about 22% of electricity in 2024–25, showing a large gap between capacity and actual output.
0.6.3 This gap exists because renewable sources operate intermittently, unlike coal plants which provide continuous baseload power.
0.7 Continued dominance of coal
0.7.1 Coal-based capacity remained at around 253–240 GW by mid-2025, forming the backbone of electricity generation.
0.7.2 Even with over 50% non-fossil capacity, more than 70% of electricity generation still comes from coal.
0.8 Limits of renewable integration
0.8.1 Solar and wind operate at lower capacity factors, producing electricity only when sunlight or wind is available.
0.8.2 Storage shortages and transmission constraints prevent renewables from replacing coal at scale.
0.8.3 Although the 500 GW non-fossil target by 2030 is technically achievable, converting capacity into sustained generation remains difficult.
0.9 Storage as the main bottleneck
0.9.1 The Central Electricity Authority projected a need for 336 GWh of energy storage for 2029–30.
0.9.2 As of September 2025, only 500 MWh of battery storage capacity was operational, indicating a massive shortfall.
1.0 Forest-based carbon sequestration: targets vs reality
1.0.1 India pledged 2.5–3 billion tonnes of CO₂ sequestration by 2030 through forests.
1.0.2 India has already sequestered 30.43 billion tonnes of CO₂ equivalents as total carbon stock.
1.0.3 However, only 2.9 billion tonnes represent additional sequestration since 2005, leaving a large gap to reach the 2030 target.
1.1 Problems with forest accounting
1.1.1 The definition of “forest cover” includes any land above one hectare with 10% canopy, including plantations and monocultures.
1.1.2 This includes eucalyptus, mango, tea, roadside plantations, which may not deliver ecological benefits equal to natural forests.
1.1.3 Satellite data shows forest cover increased by only 156 sq km since 2021, raising doubts about ecological improvement.
1.2 Implementation challenges in afforestation
1.2.1 Under the Compensatory Afforestation Fund Act (2016), around ₹95,000 crore has been accumulated.
1.2.2 However, utilisation has been uneven, with some states using only 23% of allocated funds over multiple years.
1.2.3 Plantation-heavy approaches prioritise carbon numbers over biodiversity and ecosystem health.
1.3 Governance and coordination gaps
1.3.1 Delays in grid connectivity, land acquisition, and state-level clearances slow renewable deployment.
1.3.2 Renewable capacity growth has not been matched by system-wide coordination across energy, land, and forest governance.
1.4 What the transition requires going forward
1.4.1 Scaling battery storage to bridge the capacity-generation gap.
1.4.2 Developing a clear coal transition roadmap to reduce baseload dependence.
1.4.3 Reforming forest governance to prioritise ecological restoration, not just plantation counts.
1.4.4 Improving data transparency to track sectoral and regional climate outcomes.
1.5 Overall assessment
1.5.1 India has broadly delivered on its quantified climate commitments, especially emissions intensity and installed capacity.
1.5.2 However, these gains have not translated into proportional reductions in absolute emissions.
1.5.3 The next five years are critical to move from headline achievements to real climate outcomes.
![UPSC coaching in India - Best UPSC coaching institute - UPSC Mentor coaching - UPSC preparation institute - IAS coaching center - UPSC online coaching - Best IAS coaching in India - UPSC classes for beginners - Civil services preparation - IAS preparation institute - UPSC mentorship program - UPSC exam guidance - IAS study material - UPSC Prelims coaching - UPSC Mains coaching - UPSC interview preparation - Best IAS online classes - UPSC coaching with personal mentorship - Affordable UPSC coaching - UPSC test series - UPSC coaching near me - Best IAS coaching near me - UPSC institute in [your city] - IAS coaching center in [your city] - The UPSC Mentor coaching - The UPSC Mentor IAS classes - The UPSC Mentor UPSC course - UPSC Mentor online program.](https://theupscmentor.in/wp-content/uploads/2025/11/cropped-THE-UPSC-1.png)